Monitoring Cells with Prometheus & Grafana
Created on 2023/03/06,This tutorial introduces how to set up and run Prometheus and Grafana to gather and display metrics for your Pydio Cells instance.
Please note that this feature is only available in the Enterprise Distribution.
Enable metrics
The backend code is instrumented with gauges and counters. We use an interface for various metrics systems (uber-go/tally), using a no-op implementation by default.
Using the --enable_metrics flag upon startup registers a Prometheus compatible collector instead of the no-op implementation.
Same goal is achieved by using the CELLS_ENABLE_METRICS environment variable, typically in your systemd file you can add:
Environment=CELLS_ENABLE_METRICS=true
Via the file system
The enable_metrics flag triggers 3 things:
- each Cells process exposes metrics as HTTP on a random port under the
/metricsendpoint (only one per process, not per service) - a
pydio.gateway.metricsservice gathers info about these exposed endpoints for all processes via the registry and lists all these endpoints as Prometheus compatible targets. - Cells updates a JSON file under
$CELLS_WORKING_DIR/services/pydio.grpc.metrics/prom_clients.json. This file is watched by Prometheus so that the endpoints can be dynamically discovered (see below).
In a distributed environment (that is if you have split your microservices on various nodes), you must install and run Prometheus on the same node where the pydio.gateway.metrics service is running.
Via https with basic auth
You can also directly expose a scrape config for Prometheus in https with basic authentication using the metrics_basic_auth flag.
WARNING this flag is useless if the enable_metrics flag is not set.
WARNING this feature is experimental and has been rather tested in dev and staging environments to monitor the application. Use at your own risk in production.
Adding --metrics_basic_auth="metrics:metrics" to your start command rather:
- starts an http server that exposes the scrape config at
<YOUR FQDN>/metrics/sdthat can be directly consumed by a client Prometheus (see below) - proxy the various metrics exposed by each process to be available via https with basic auth
Install Agents
You can download Prometheus and Grafana binaries for your platform. Both websites also provide a complete documentation and some best practices to install these tools.
Another (and easier) way to go is to directly use the Docker images that can be found on Docker Hub.
Configure Prometheus
Edit prometheus.yml to add a new job in the scrape_config section, using either the file_sd_configs or the http_sd_configs Prometheus discovery mechanism.
This tells Prometheus where to watch to get an up-to-date list of scraping targets.
The scrape_configs section of your Prometheus config should look like this, knowing that:
- the first job is set by default by Prometheus to monitor itself,
- you have to choose if your Cells is local or not: you generally have either one or the other
cellsconfig.
# A scrape configuration containing exactly one endpoint to scrape:
scrape_configs:
  # The job name is added as a label `job=<job_name>` to any timeseries scraped from this config.
  - job_name: 'prometheus'
    # metrics_path defaults to '/metrics'
    # scheme defaults to 'http'.
    static_configs:
    - targets: ['localhost:9090']

  # Scrape configuration locally or via a mounted volume
  - job_name: 'cells@localhost'
    file_sd_configs:
      - files:
        - {PATH_TO_CELLS_WORKING_DIR}/services/pydio.gateway.metrics/prom_clients.json

  # Scrape remote configuration and metrics via http
  - job_name: 'cells@http'
    scheme: https
    tls_config:
      # insecure_skip_verify: true # e.g within docker compose setups
    basic_auth:
      username: "metrics" # adapt here
      password: "metrics" # and here
    http_sd_configs:
      - url: "https://cells:8080/metrics/sd"
        basic_auth:
          username: "metrics"  # and also here
          password: "metrics"  # and here
        tls_config:
          insecure_skip_verify: true
You can configure Prometheus to start on the port you wish, default is 9090.
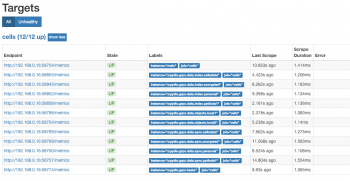
In the machine where Prometheus runs, you can check that all processes are correctly detected by visiting http://localhost:9090/targets.
Grafana
First Start Grafana. By default, it is accessible at port 3000. You can define your own specific port using the GF_SERVER_HTTP_PORT environnement variable.
Choose an admin/password and perform basic install steps.
Add a Prometheus DataSource in Grafana pointing to the Prometheus instance defined in the previous step.
The Grafana Dashboard
A simple dashboard has been published on the Grafana website.
It can be simply imported with the Grafana UI by following steps:
- In the left menu, select Dashboard > Import
- In the "Grafana.com Dashboard" text field, enter the dashboard ID 9817
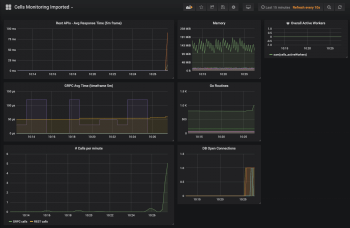
The new dashboard should be available and show something like the image below.
Advanced Dashboard
For power users who want to gather and display more info about their server, we have also prepared a dashboard with additional gauges.
This section describes the required configuration to display them in a more complete Grafana dashboard.
Prerequisites
- Download and install the Node Exporter application,
- Import this Dashboard (ID:
15153) in your Grafana instance.
System metrics
Append this configuration to your prometheus.yml to enable prometheus to collect and scrape the metrics.
  - job_name: 'node_exporter'
    static_configs:
    - targets: ['localhost:9100']
To run the node_exporter, it is advised to create a service file and use systemd.
Here is a simple template:
[Unit]
Description=Node Exporter
After=network-online.target

[Service]
User=pydio
Group=pydio
Type=simple
ExecStart=/usr/local/bin/node_exporter

[Install]
WantedBy=multi-user.target

