Monitoring Tools
When deployed inside an infrastructure providing monitoring dashboard and tools, Cells provides some specific entry points for grabbing statistics and healtcheck information.
Healthcheck Endpoint
Cells provides an optional HTTP endpoint that lists all micro-services and their statuses (in JSON format). If all services are up and running, endpoint returns with a 200 status code, and a 500 if one service is down.
To enable this endpoint, pass a port number via the CELLS_HEALTHCHECK=6565 environment variable (or via the --healthcheck command flag). Once set, healthcheck endpoint is available with a GET http://your-cells:6565/healthcheck/ request.
Basic Authentication is available by setting the following configuration :
./cells admin config set pydio.grpc.healthcheck username "myusername"
./cells admin config set pydio.grpc.healthcheck password "mypassword"
Please beware that this endpoint is not protected by default: it is your responsibility to correctly setup your firewall or use the basic authentication.
Prometheus / OpenMetrics
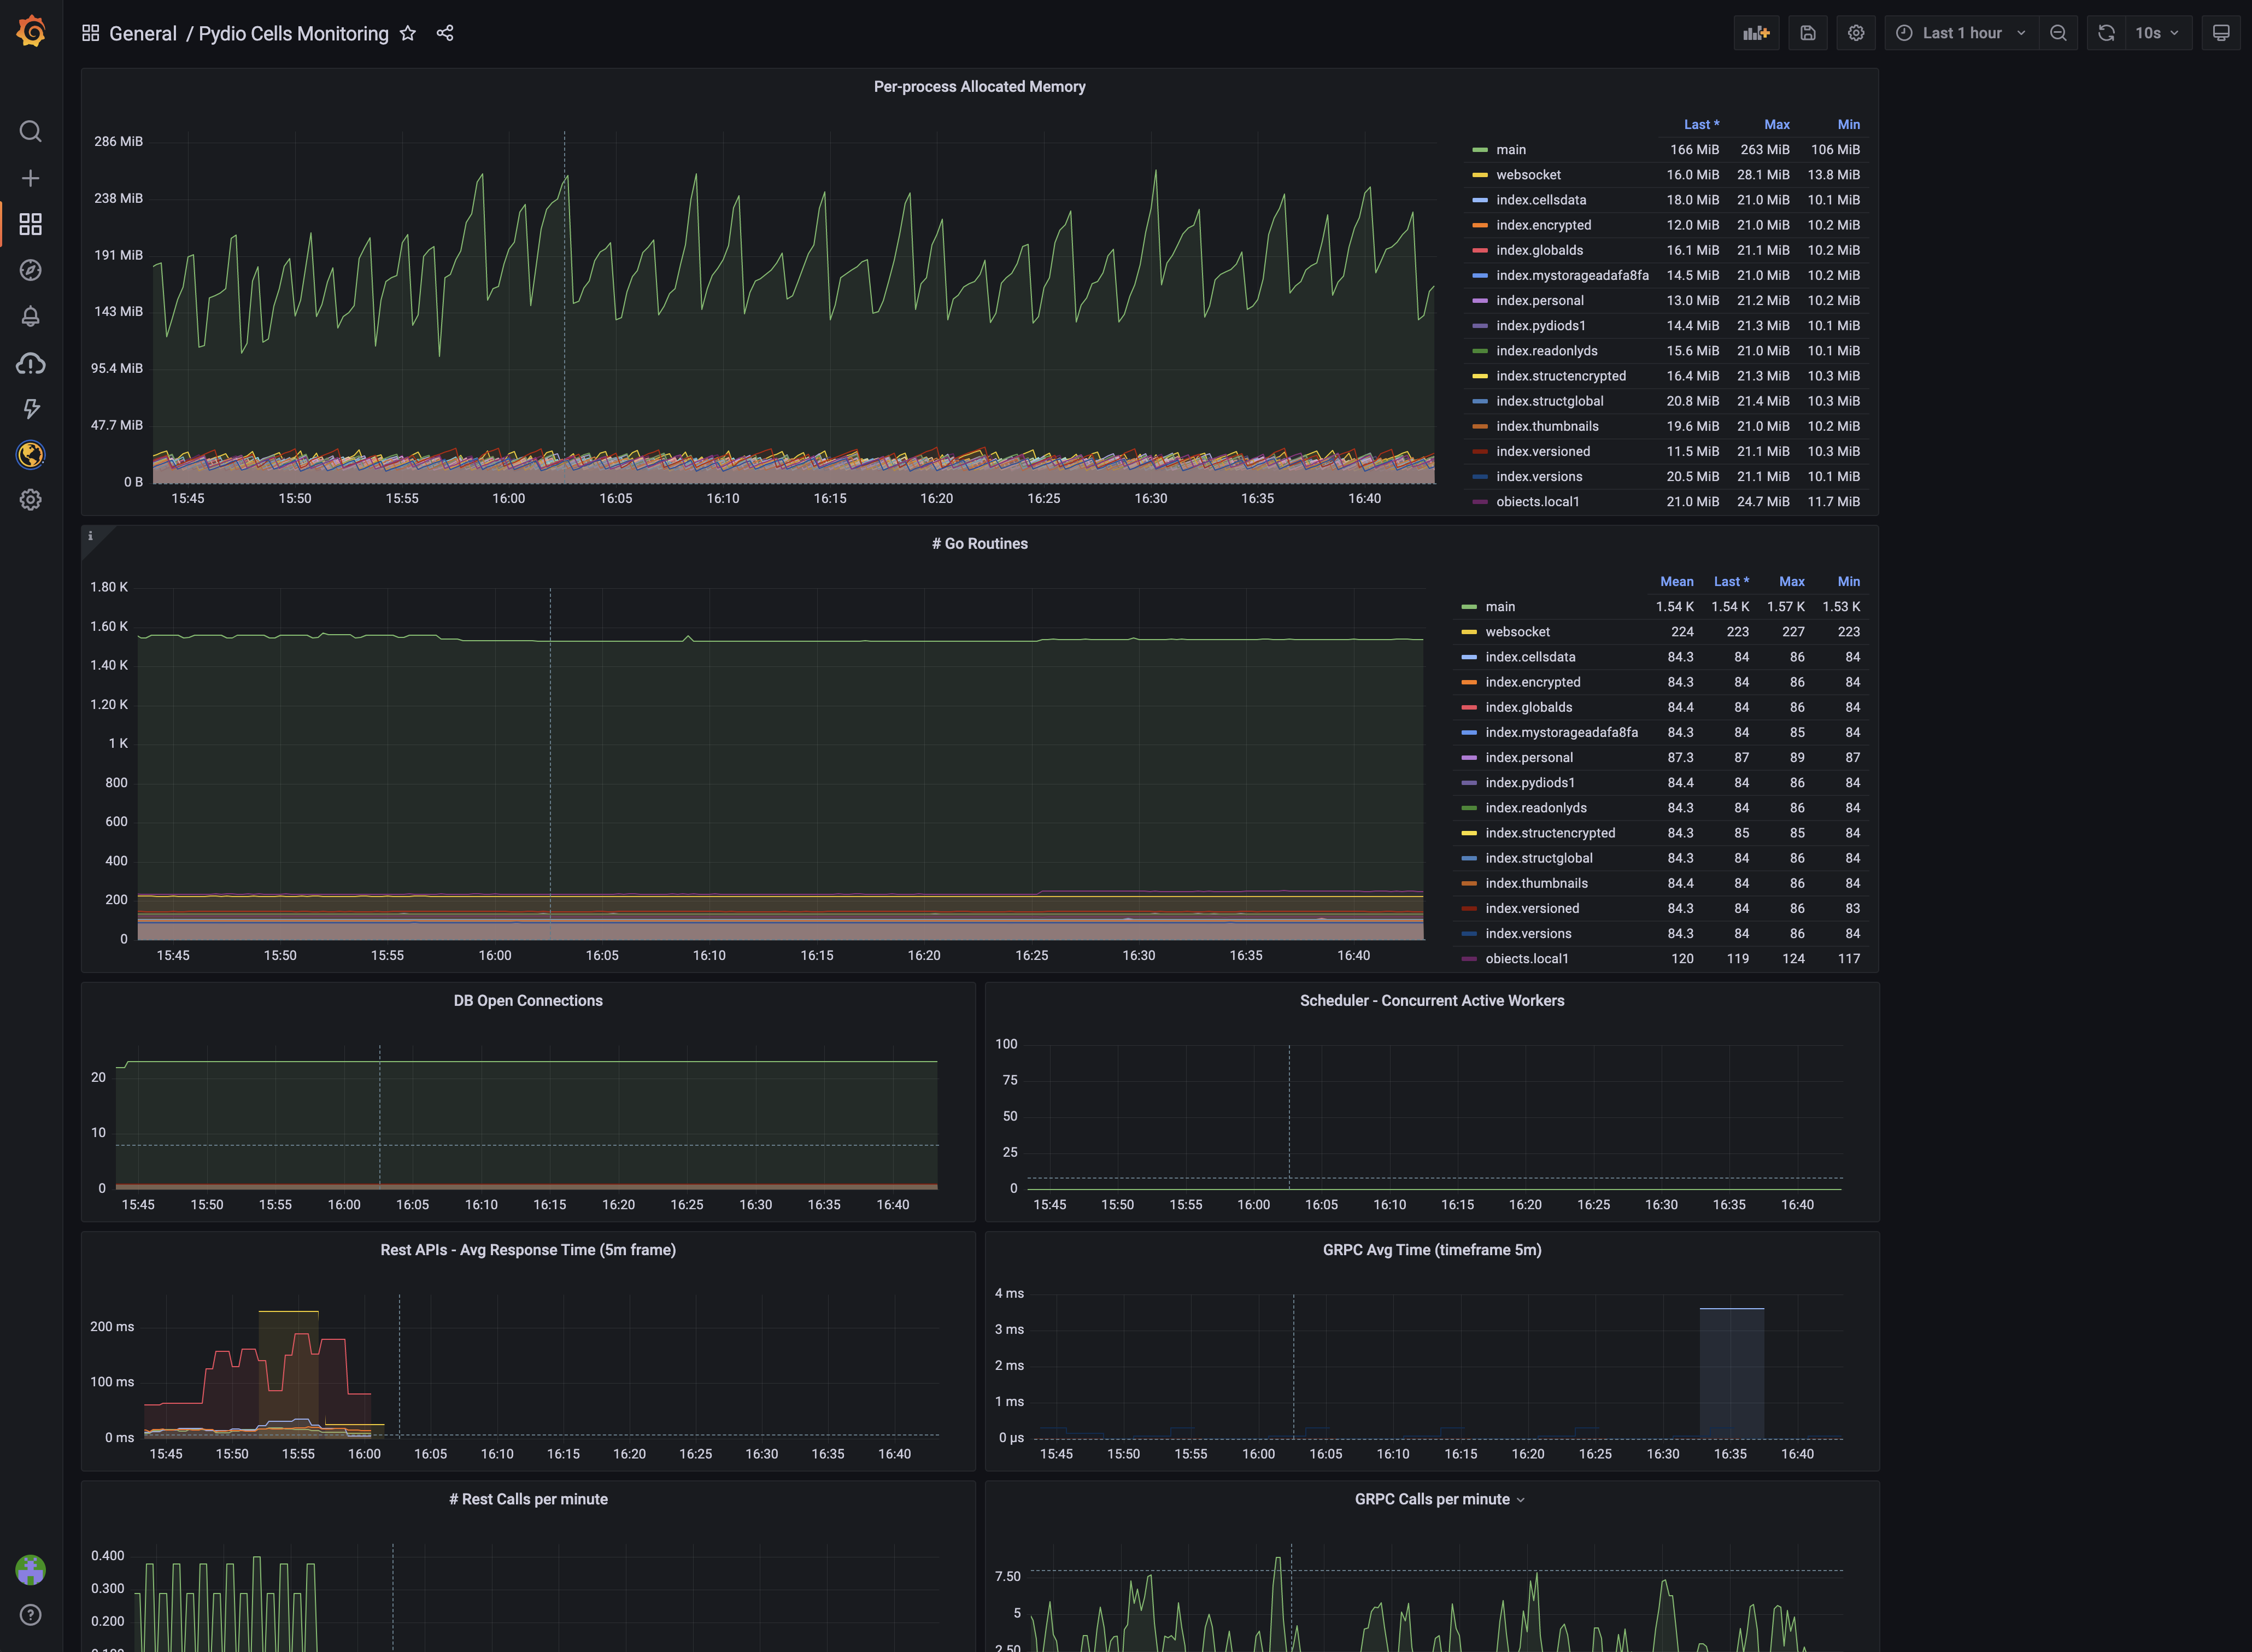
Cells code is instrumented with Prometheus gauges for providing metrics about its internals (Golang Goroutines number, memory used per service, etc.). It is best coupled with a Grafana monitoring dashboard.
Prerequisites to collect the metrics are the following:
- Enable the metrics endpoints on Cells by providing the
CELLS_ENABLE_METRICS=trueenvironment variable or by adding the flag--enable_metricsto cells' start command. - Prometheus
and for the prometheus.yml configuration append this instruction.
- job_name: "cells"
    file_sd_configs:
      - files:
          - ${CELLS_WORKING_DIR}/services/pydio.gateway.metrics/prom_clients.json
Make sure to replace $CELLS_WORKING_DIR by your actual working directory.
Please refer to the knowledge base for more information about the Prometheus/Grafana configuration.
Back to top