System Logs
Following the standard 12-factor architecture pattern for micro-services, all logs are redirected by default to the standard output. They are also output in rotating log files under CELLS_WORKING_DIR/logs/pydio.log.
Configuration
By default, logs are formatted in an Apache-like format. An embedded log collector parses and stores them in a local index to enable easy search and analyse via the admin console. To enable logs collection by external systems like ELK (Elastic Search, Logstash, Kibana), you can switch to the "JSON" mode: log messages are then output in JSON format.
You can use the following flags (or they ENV variable equivalent):
log(orCELLS_LOG): Sets the log level (debug, info, warn or error)log_json(orCELLS_LOG_JSON): Sets the log output format to JSON instead of textlog_to_file(orCELLS_LOG_TO_FILE): Write logs on-file in CELLS_LOG_DIR
Default is --log info --log_json=false --log_to_file=true: logs are outputted in console format at the Info level and appended to a CELLS_LOG_DIR/pydio.log file.
Browsing the logs
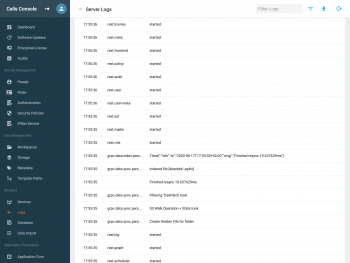
The logging service collects and parses logs. You can browse them in your admin dashboard under Backend > Logs:
You can read them as the following:
- Date: the time when the event happened
- IP: the IP if it happened elsewhere (could be a user etc...)
- User the username of whom it happened to
- Service: the service that is handling it
- Message: what happened with the service concerned (such as stopping, restarting, etc...)
You can left click on any error to popup a detailed windows.
Search the logs by using the search fields in the top right corner. For advanced filtering, click on the inverted triangle to choose a filter type and enter your parameters in the field that is on its left.
Filter types are:
- Full-text search (selected by default): filter by anything such as usernames, etc...
- Pick one day: pretty straightforward, choose a date day to see log for this day.
- Time Period : you can choose more than one day by putting from this day to that day.
