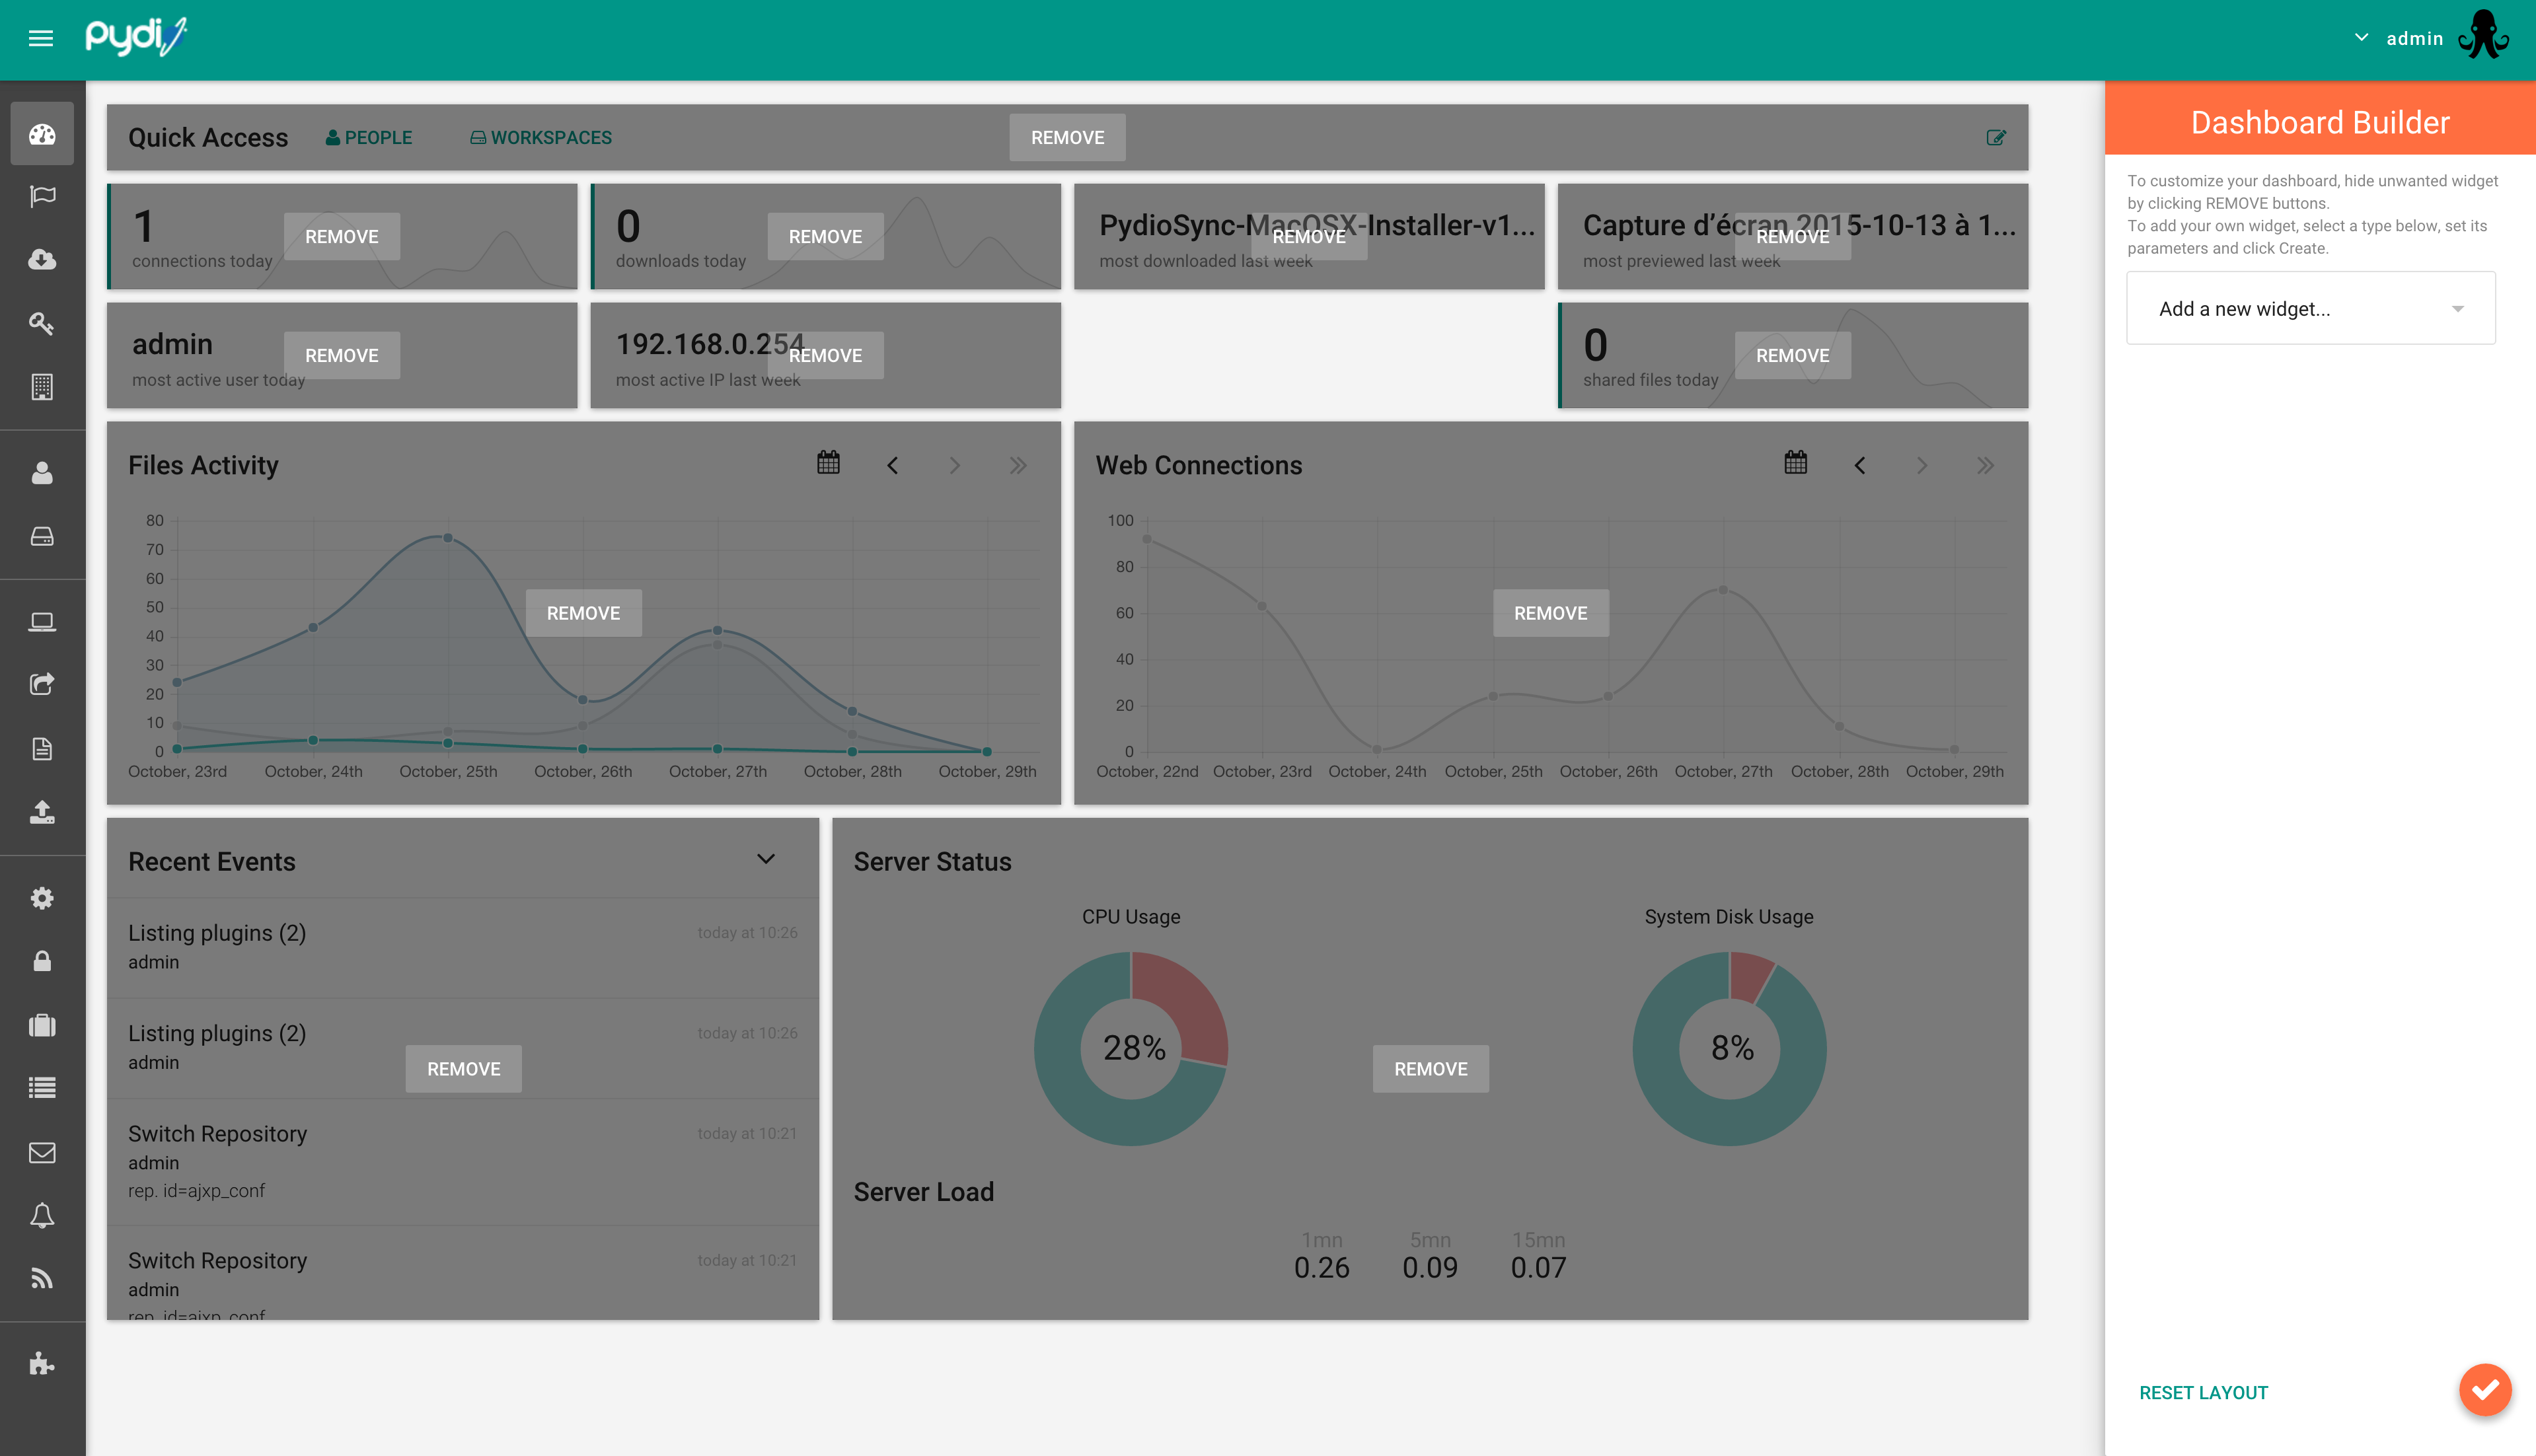
Administrator Dashboard
The dashboard is the main page of Pydio Enterprise. This page allows you to quickly know what is going on your server. You can easily change the way you want this page by adding, deleting and reordering widgets.
Dashboard Builder
You can access Dashboard Builder by clicking on the bottom-right orange button. This panel allows you to create/remove plugins. I you want to get back the default settings, you can reset the dashboard layout.
Each Widget you add should be configured.
It's also possible to reorder the widget, just drag and drop the wanted widget.
Widget types
When you add a widgets, you'll have some settings to fill depending the type. For some widgets, you can apply a filter on a selected workspace. It is also possible to filter the data by file extension (for example you just want to monitor downloads on .doc files).
Here are the different widgets attributes:
- Legend / Title
- Data type (Downloads, Uploads, ...)
- Sampling frequency
- daily (last 10 days)
- weekly (last 4 weeks)
- monthly (last 12 months)
- Workspace filter [optional]
- Filename filter [optional]
- "*.doc" (will monitor only .doc files)
- "prefix*" (will monitor only files with this prefix)
- Refresh delay
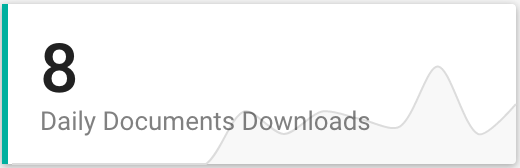
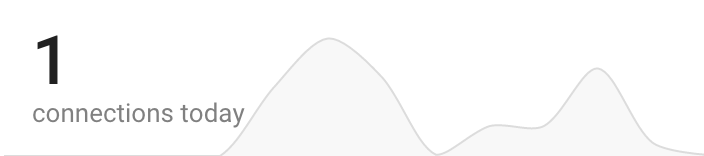
Small graph:
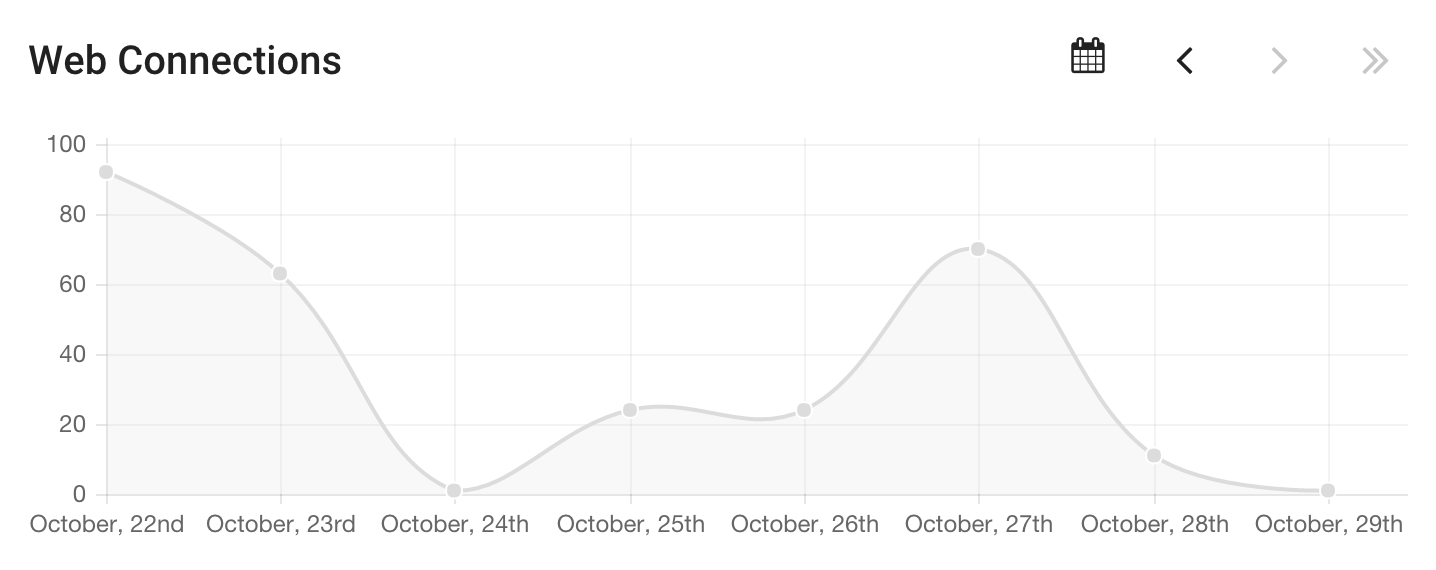
Big graph:
Most active:
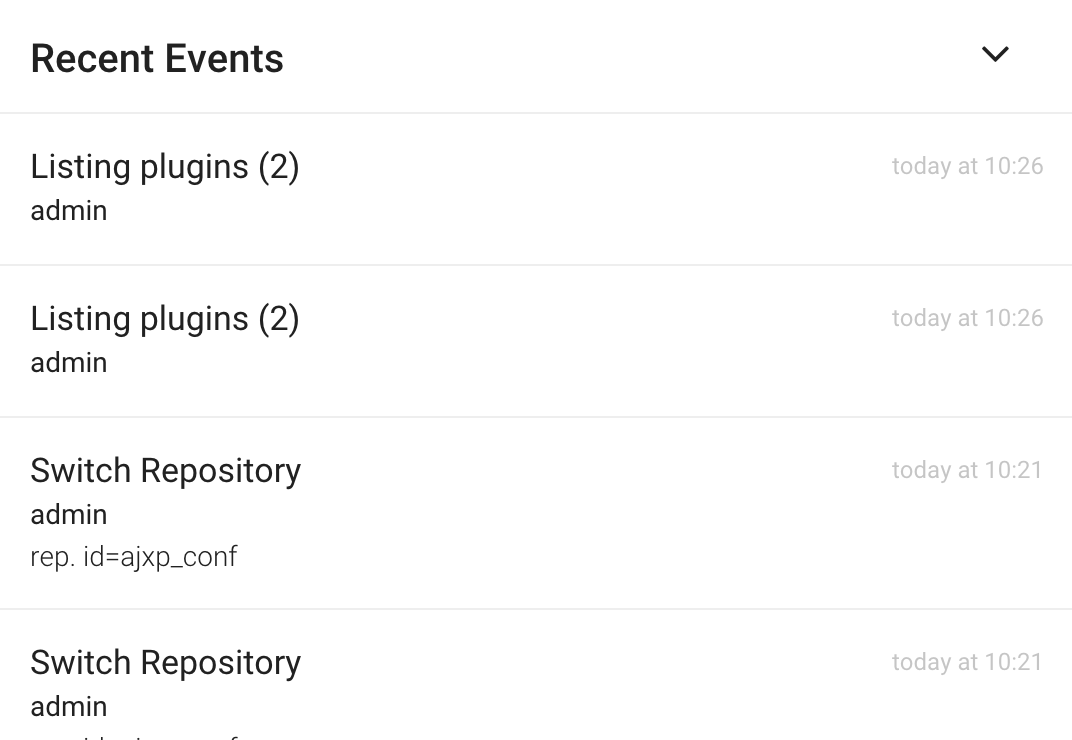
Recents events:
Server status:

Quick access:

Example
Let's say we want to create a small graph to monitor the ".docx" downloads daily on a selected workspace:
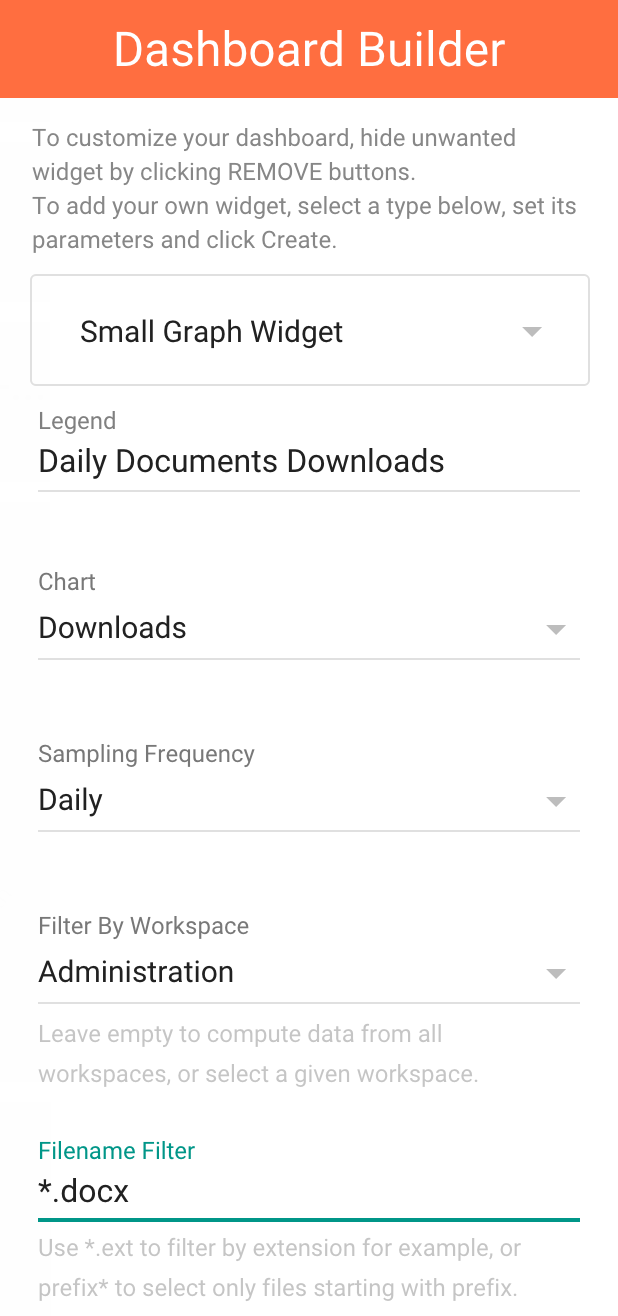
- Click on the button to add a widget
- Choose Small Graph Widget
- Fill the legend with the name you want
- Select Downloads in the Chart combobox
- Pick Daily as sampling frequency
- Choose the workspace you want to filter
- Type "*.docx" to filter only ".docx" files
- Change the Refresh interval if you want
- Click on create widget
Here is the resulting widget: